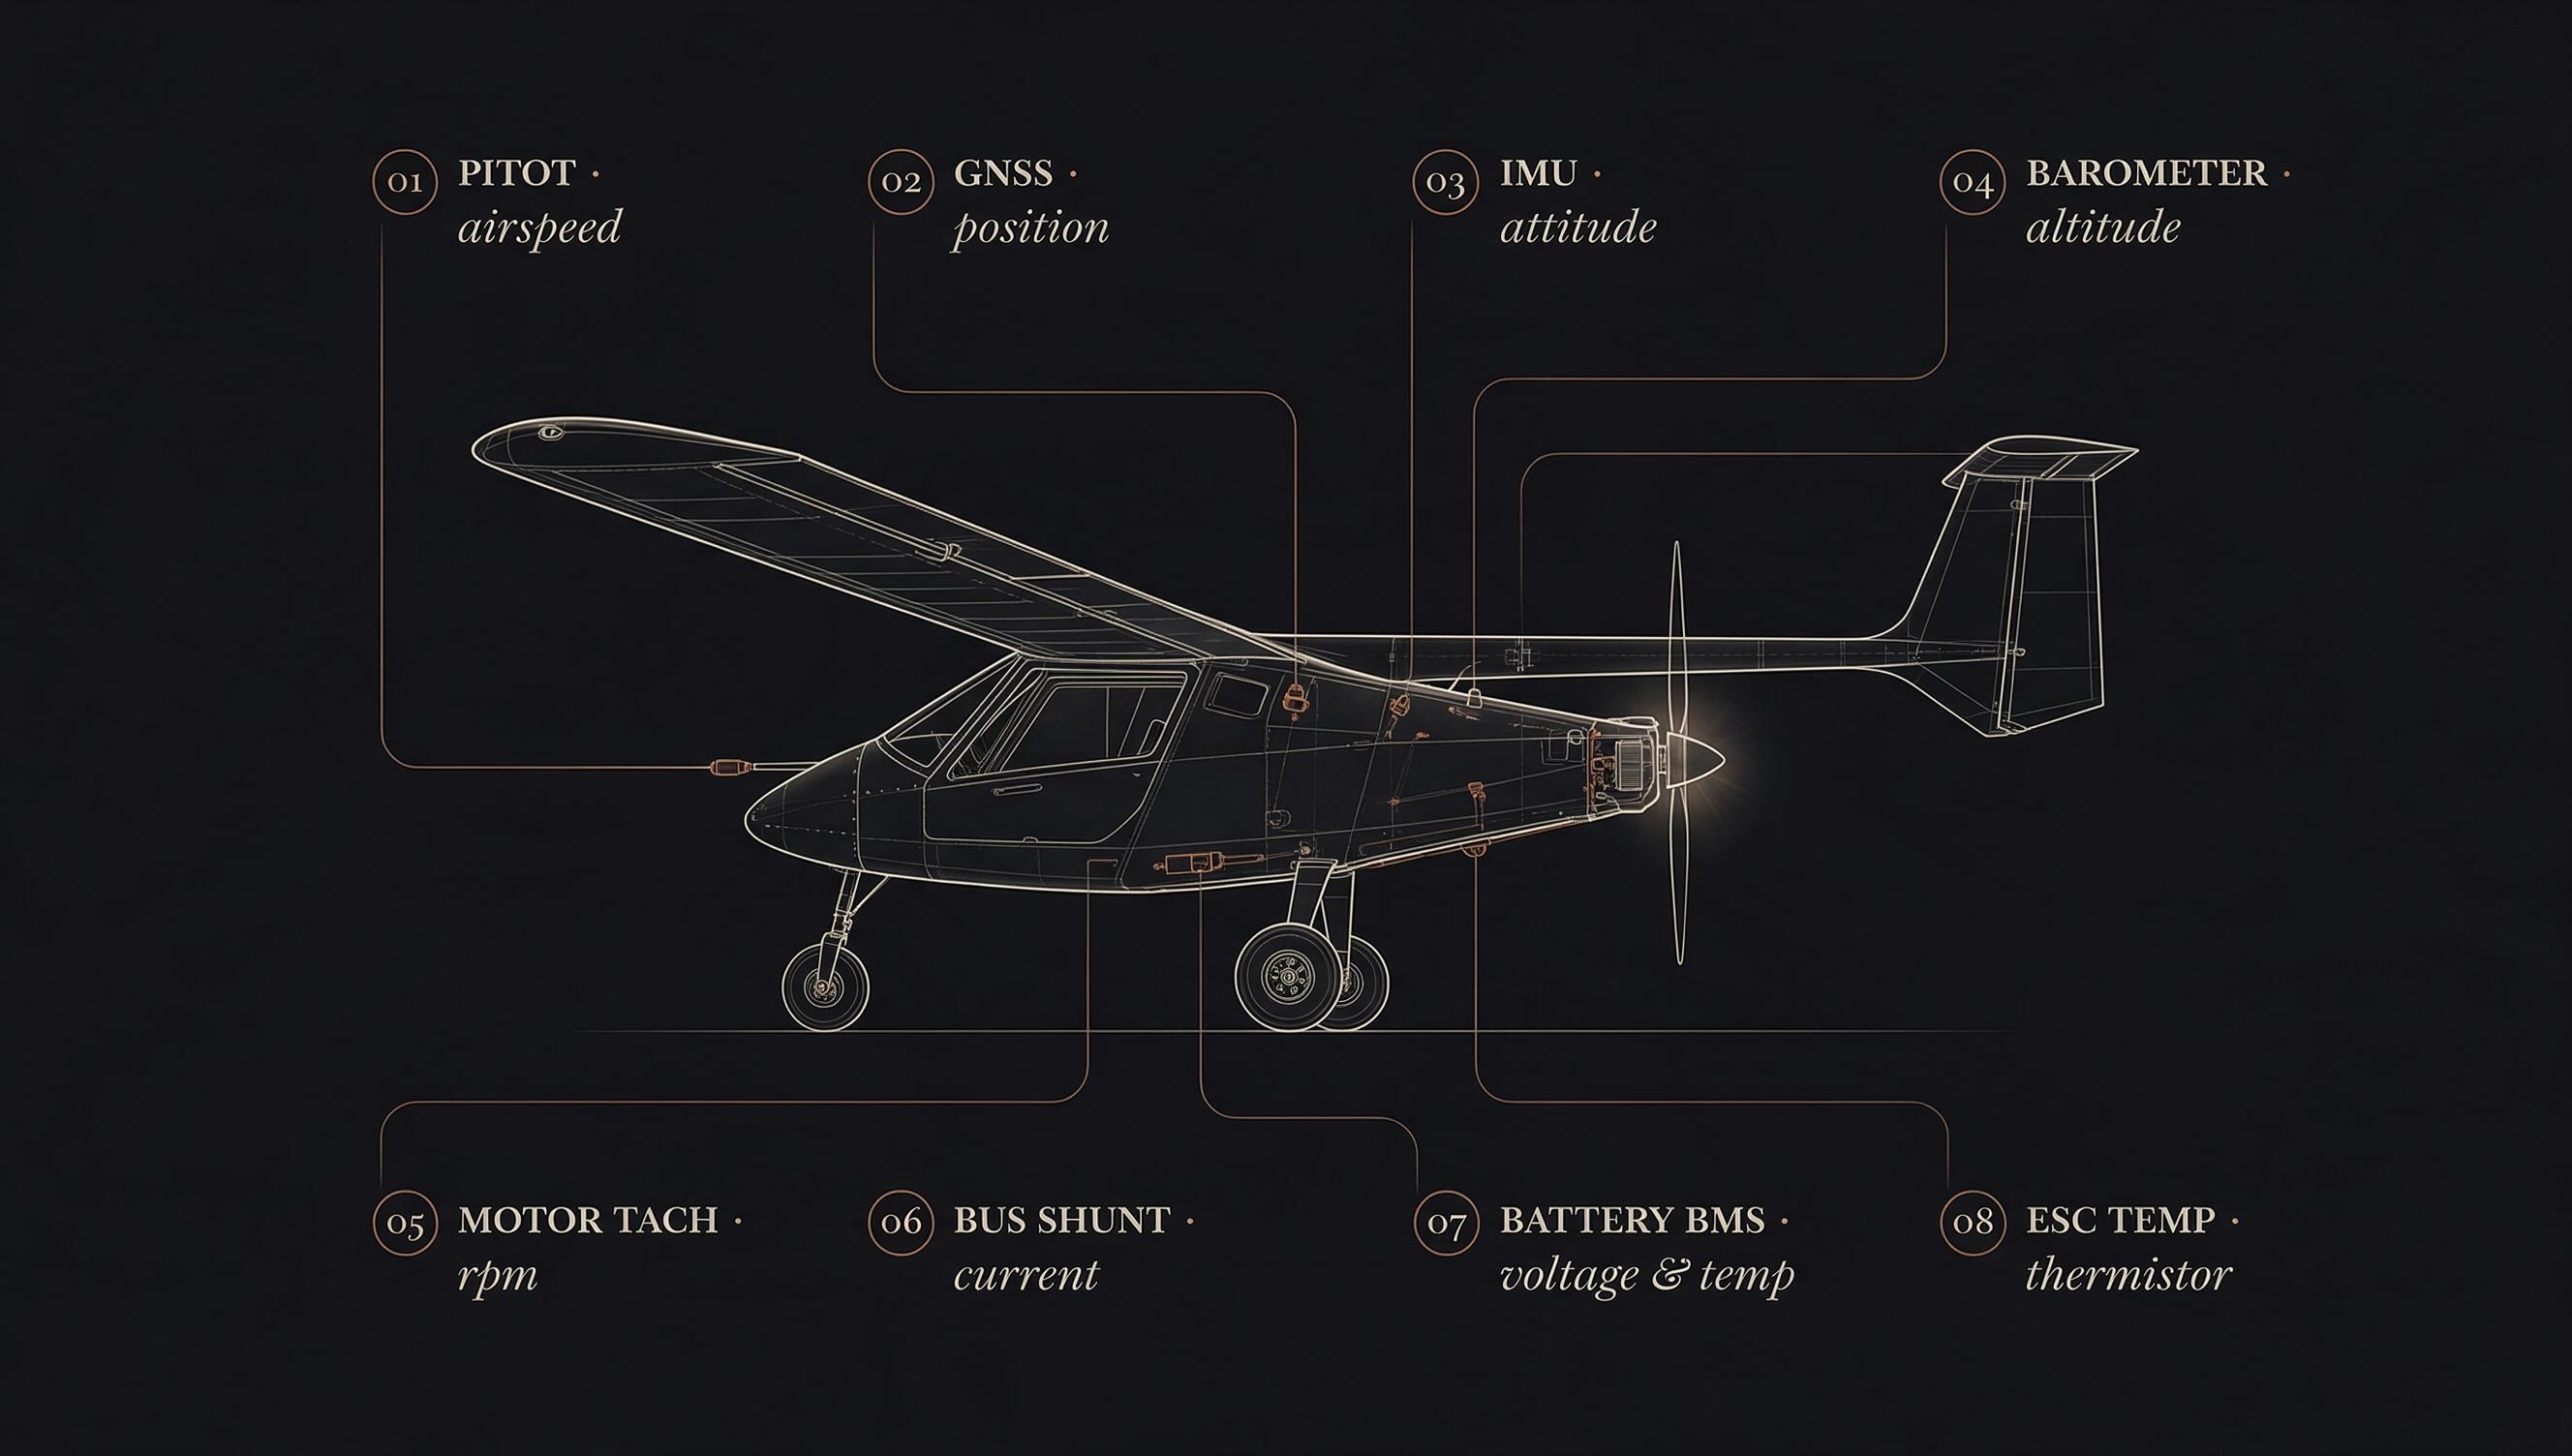
Measure real power
Voltage, current, temperature, RPM — sampled fast enough to see the instantaneous behaviour of the aircraft, not just averaged trends.
Kyte X1 is the first experimental aircraft in the PsiWings research program. Its primary objective is to create a reliable relationship between aircraft configuration, flight condition, electrical power consumption, and real-world endurance — before we make any bigger claims.
This is not a rhetorical question. It is the specific problem Kyte X1 exists to attack — not with claims, but with instrumentation, flight tests, and a growing dataset.
Voltage, current, temperature, RPM — sampled fast enough to see the instantaneous behaviour of the aircraft, not just averaged trends.
Airspeed, altitude, climb rate, attitude, wind, payload. Every environmental factor becomes a variable — not an excuse for the numbers.
Physics-based equations first — P = f(V, m, ρ, config). Then fit them to real flight data, and note exactly where the model still lies.
Every flight begins with a prediction and ends with a post-flight review. The delta between them is where the next experiment starts.
Every joule of battery energy must travel through four conversions before it becomes flight. Each conversion costs a percentage. This diagram shows exactly where the losses are — measured individually, so the biggest opportunity to improve is always visible.
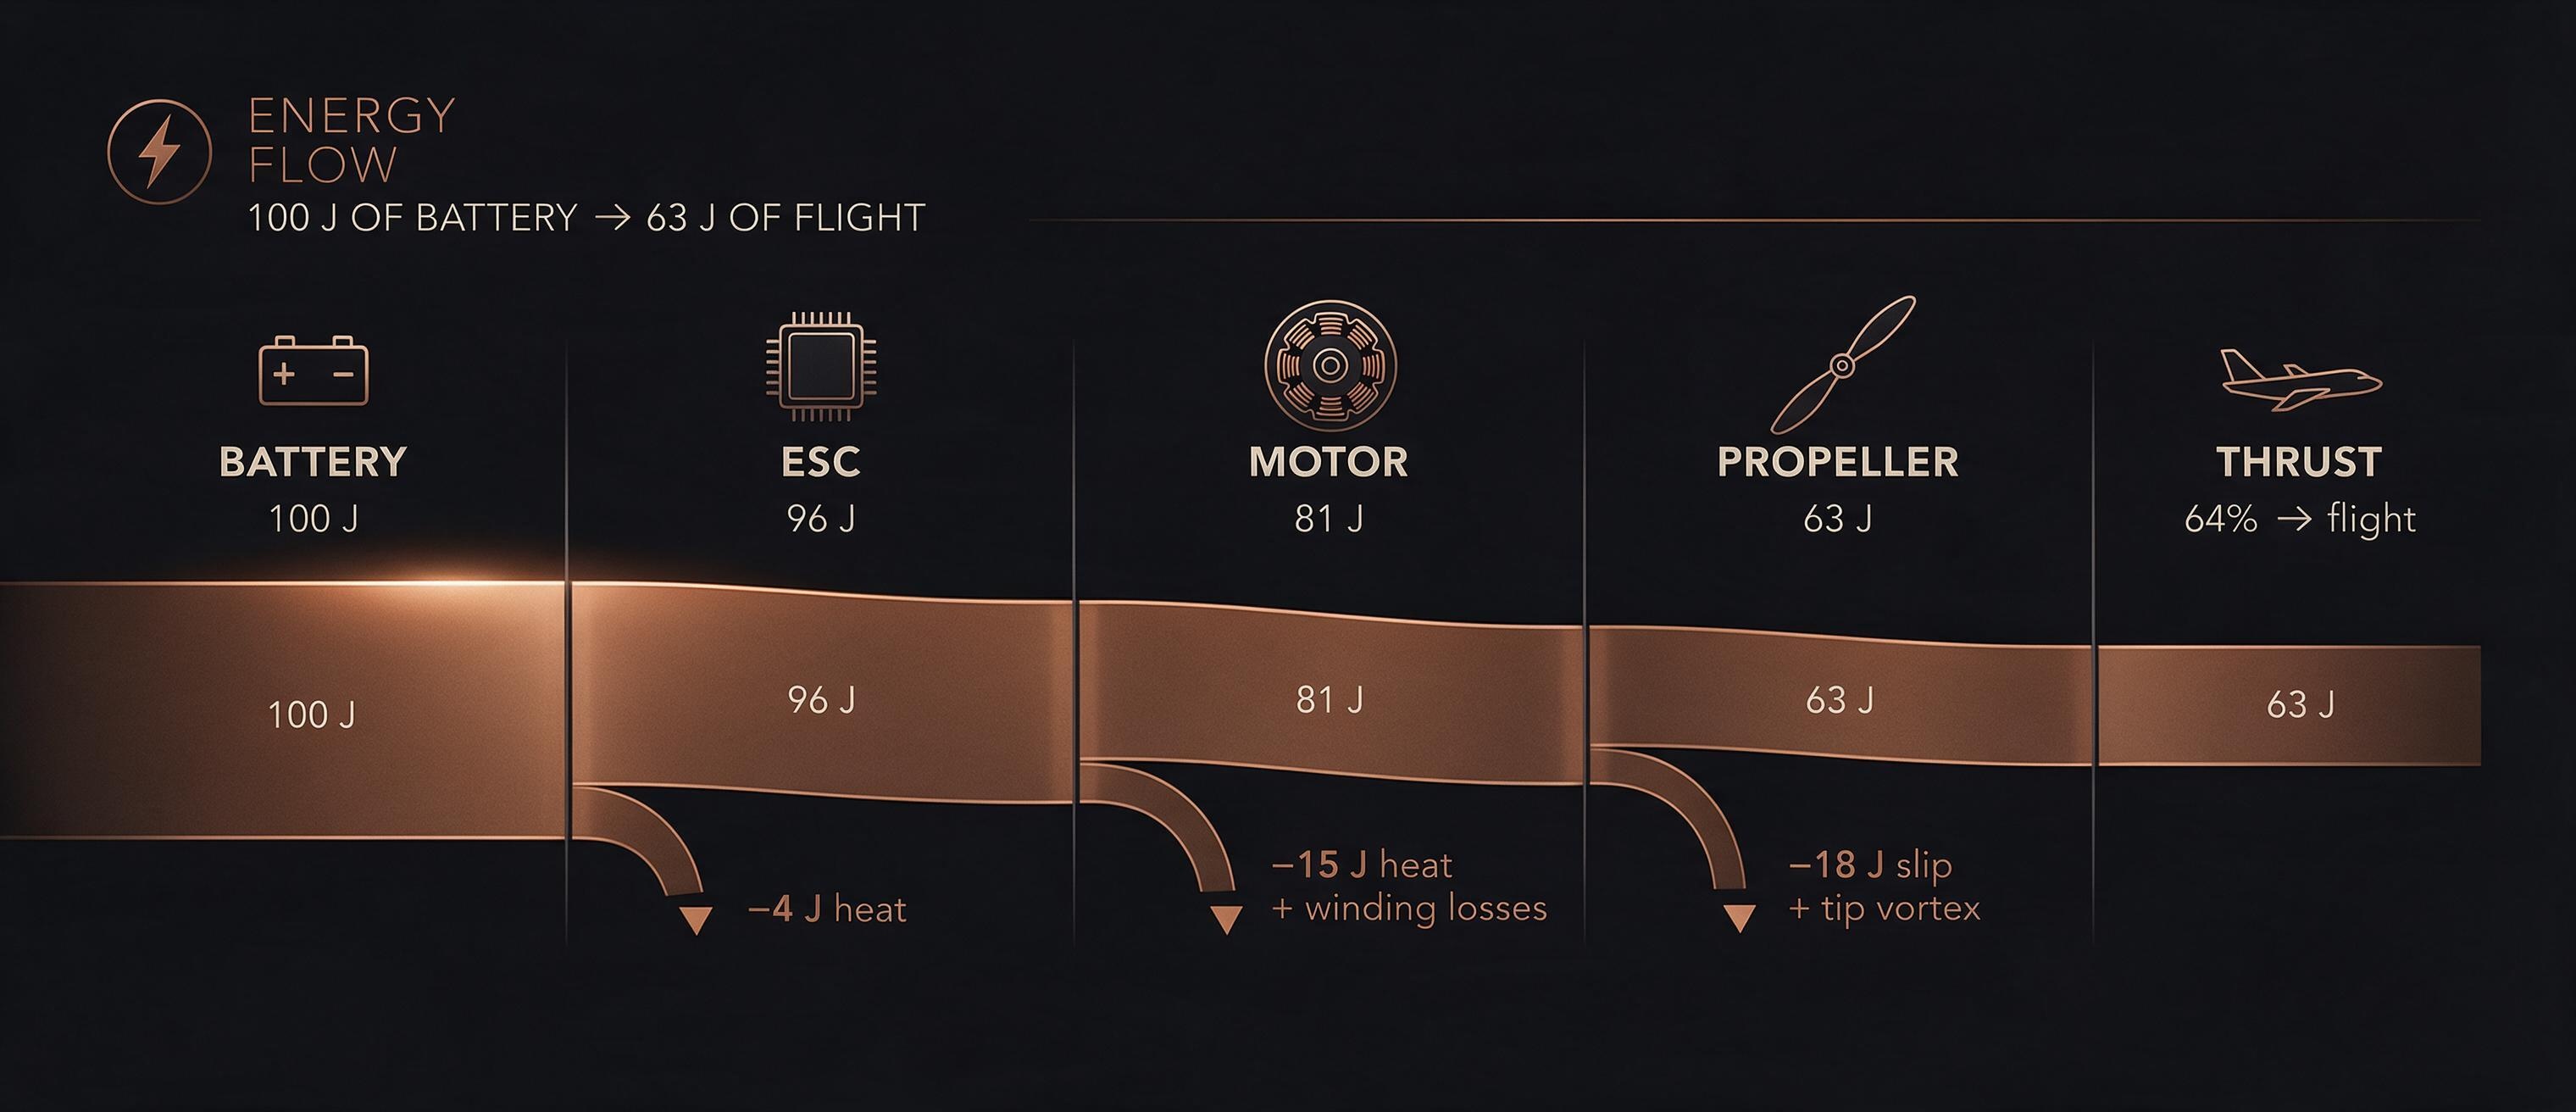
The propeller is the largest single point of loss — and the one with the most physics still worth studying.
Battery and ESC losses have well-established engineering solutions. Motor efficiency is a mature discipline. But propeller aerodynamics — especially at these Reynolds numbers — is where a young engineer can still find real questions to answer.
One aircraft — six directions to ask questions in. Each axis below is a physical variable that changes how much energy the aircraft consumes. Each has a shape that first-principles physics predicts. The research is measuring how far reality actually deviates from that prediction.
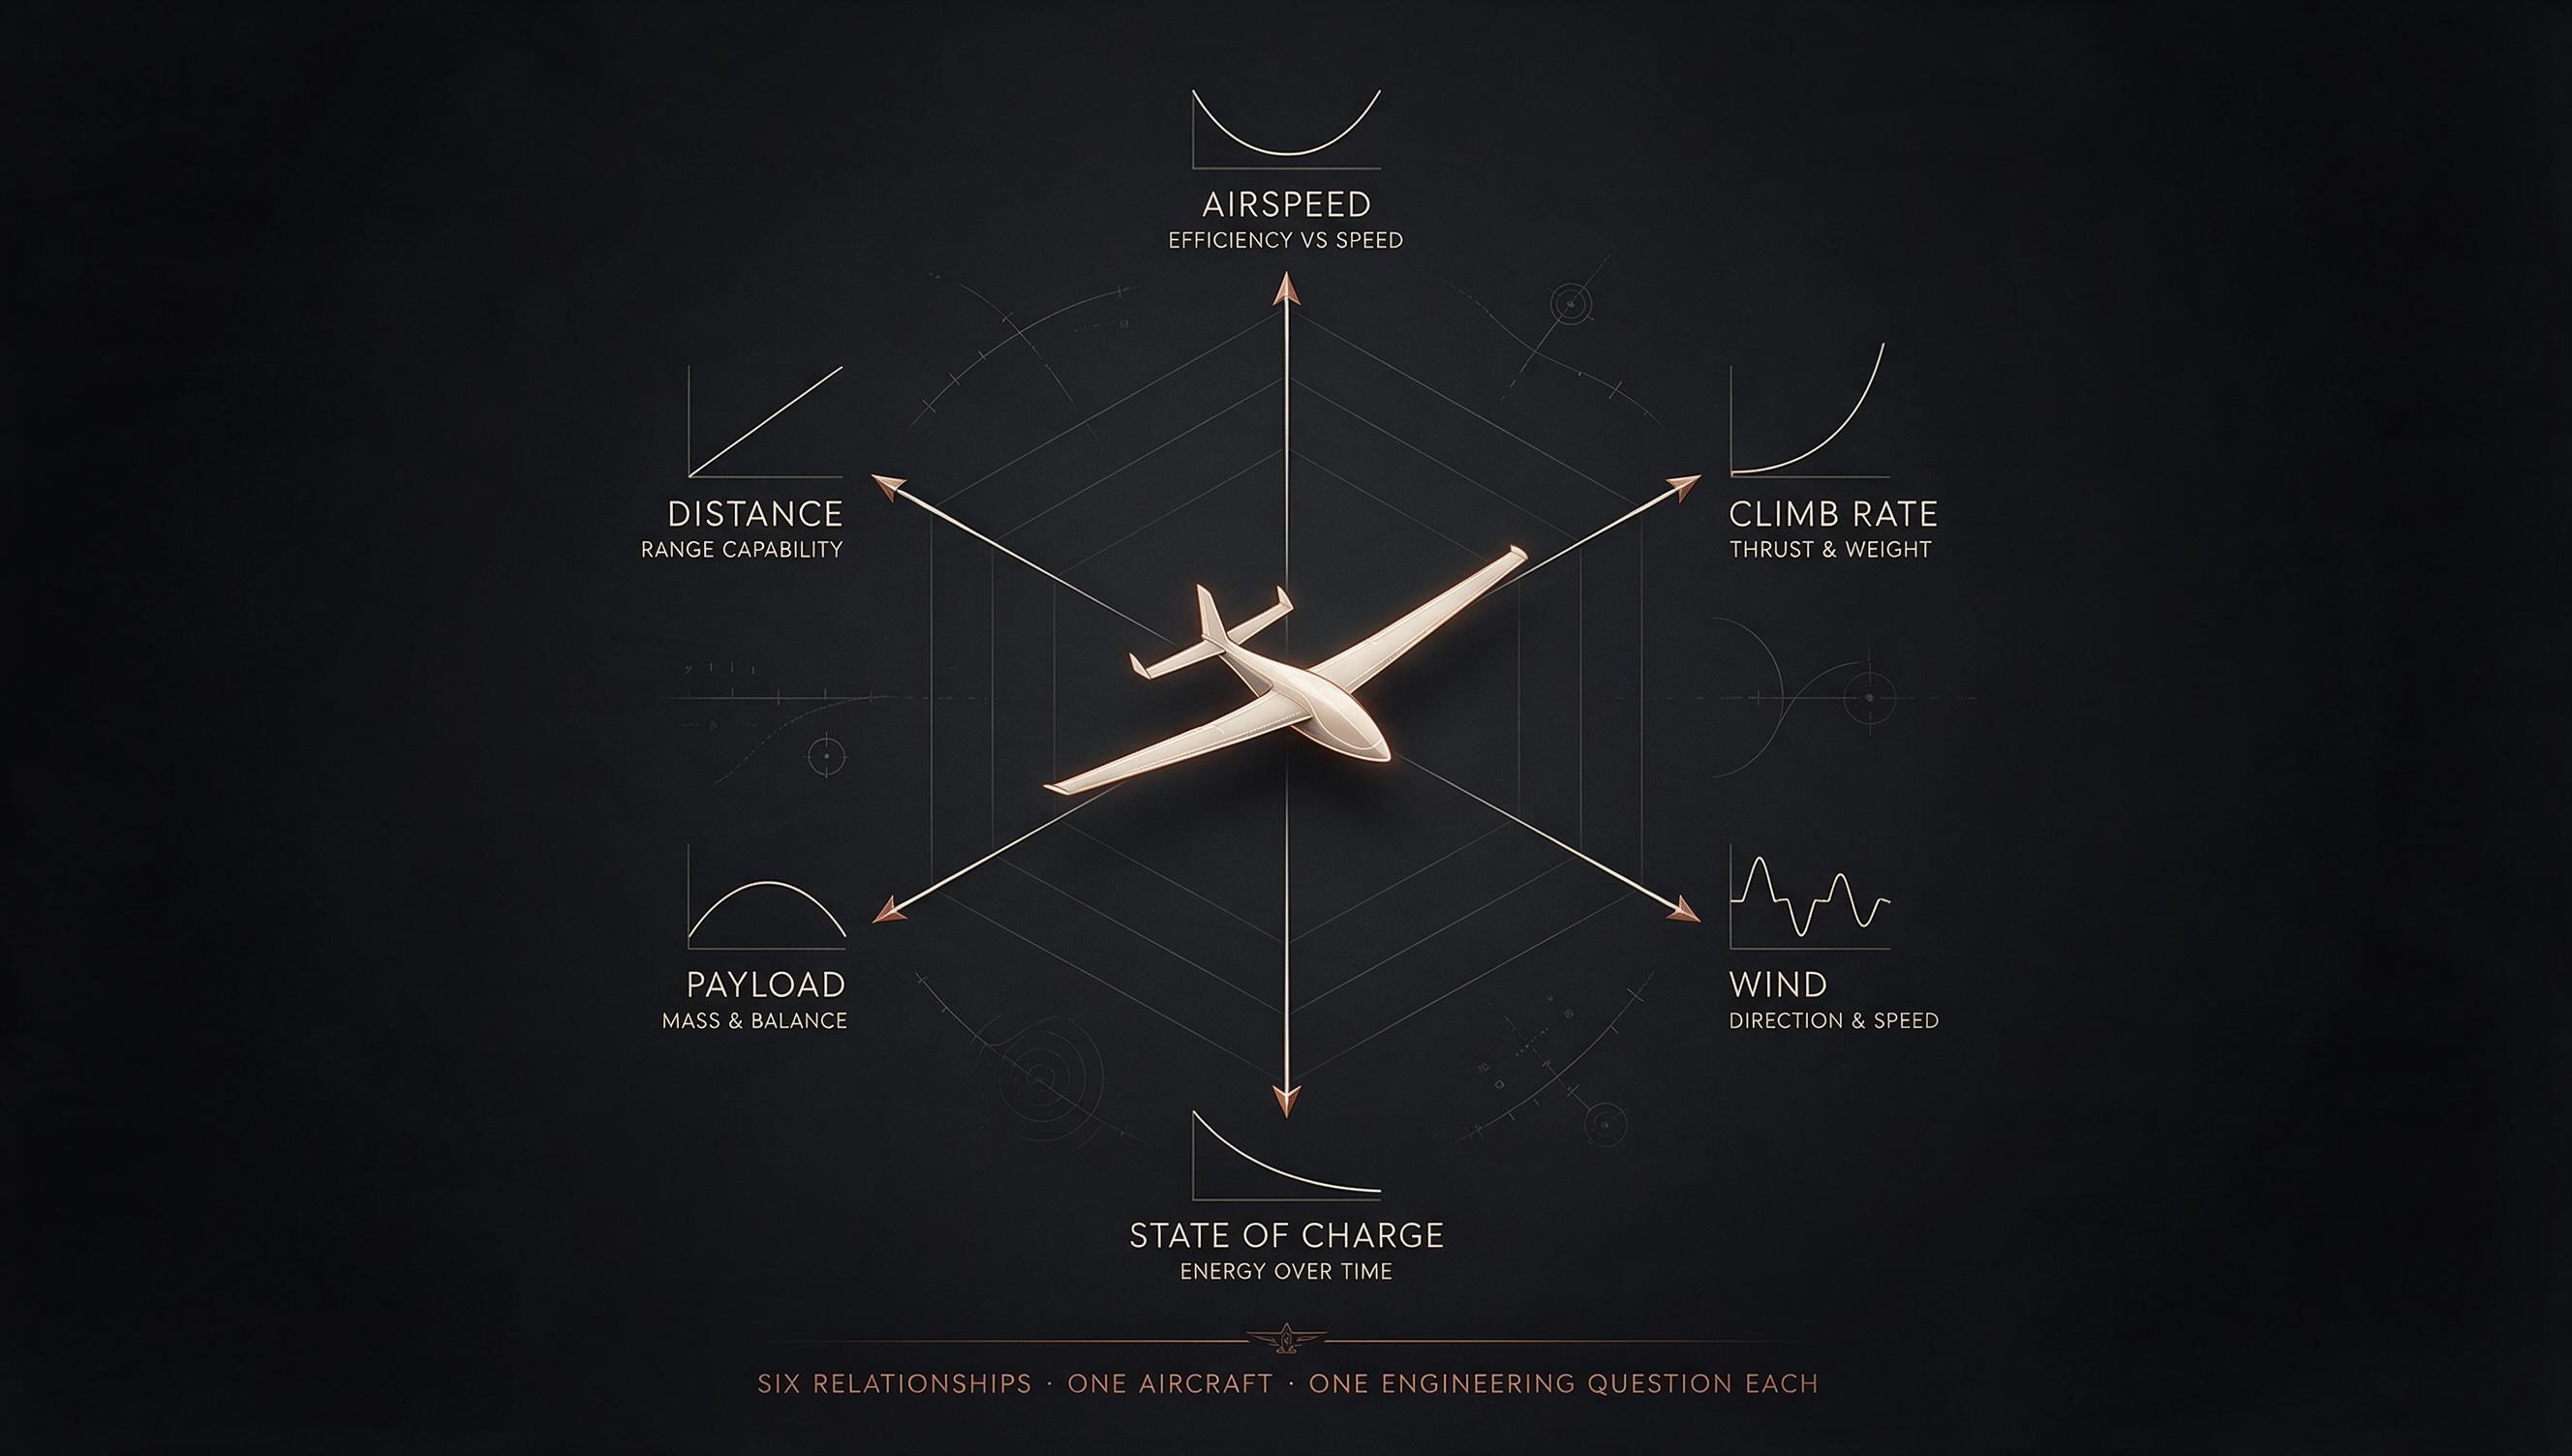
Every gap between the predicted curve and the measured curve is a new engineering question worth flying.
Sampled at high rate. Annotated by flight condition. Cross-referenced with wind and payload. Released internally as the foundation for Kyte X2. Not a paper yet — but a real, honest, useful dataset.